-
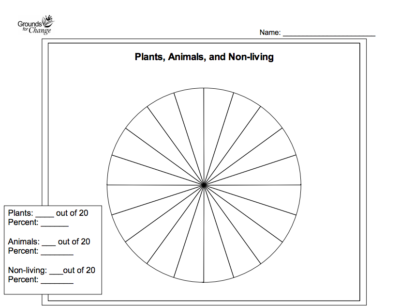
Students learn to calculate percentage by finding plants, animals and non-living objects around the school yard and illustrating them in a pie chart. Wrap up: What had the highest percentage: plants, animals, or non-living? Was one dominant for most/all of the students?
-
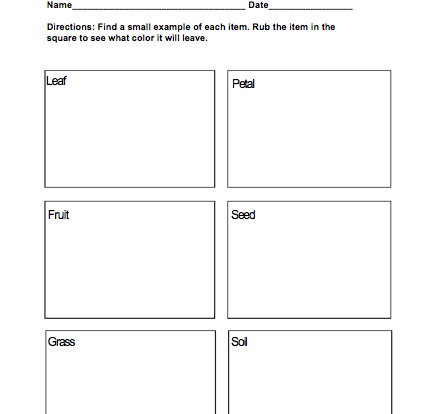
Learn about color and its variability among common schoolyard objects. Students find the item listed on the activity sheet and rub it on the page to see what color is left behind. Wrap up: Students compare colors and then discuss why different objects contain certain colors or why others vary.
-
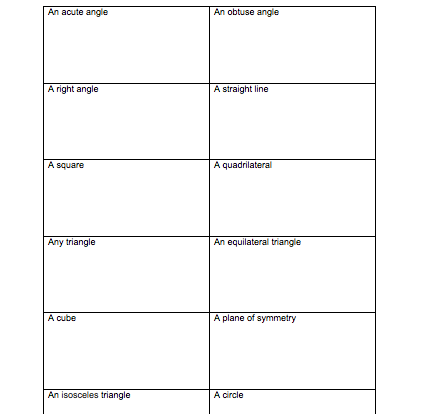
Students attempt to find all of the geometric shapes/angles listed within the scope of the classroom or schoolyard. Wrap up: Discuss the objects students used to fill their quest sheet.
-
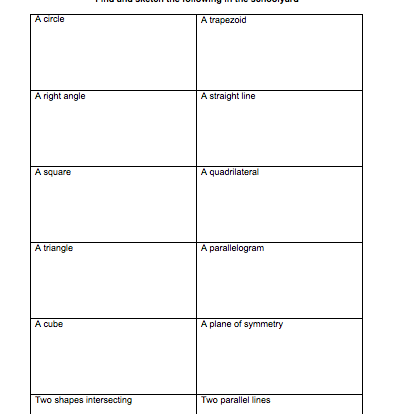
Students attempt to find all of the geometric shapes/angles listed within the scope of the classroom or schoolyard. Wrap up: Discuss the objects students used to fill their quest sheet.
-
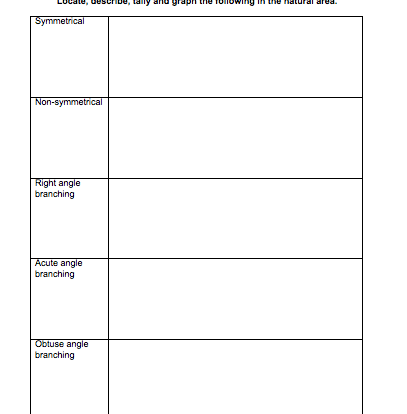
Students locate, describe, tally and graph the geometry they observe in the natural area/ schoolyard. Wrap up: compare graphs created by the students.